 RFQ
RFQTechnical Article
-
Influence of Speaker Placement on Acoustic Performance: Simulation-Based Optimization for Product Sound Design

In the consumer electronics market for audio products, some designs focus on sound performance while others focus on ID appearances and prices. A unique ID sometimes limits the position of the loudspeakers. How can we get a balance between ID appearances and acceptable sound performance? It’s always a critical task for the designer. The FEA (Finite Element Analysis) tool can be used to predict and analyze the influences of sound performance when the ID is initially locked down, and the optimized position of the loudspeaker can be chosen.
Here are three scenarios with different positions of loudspeakers inside a product.
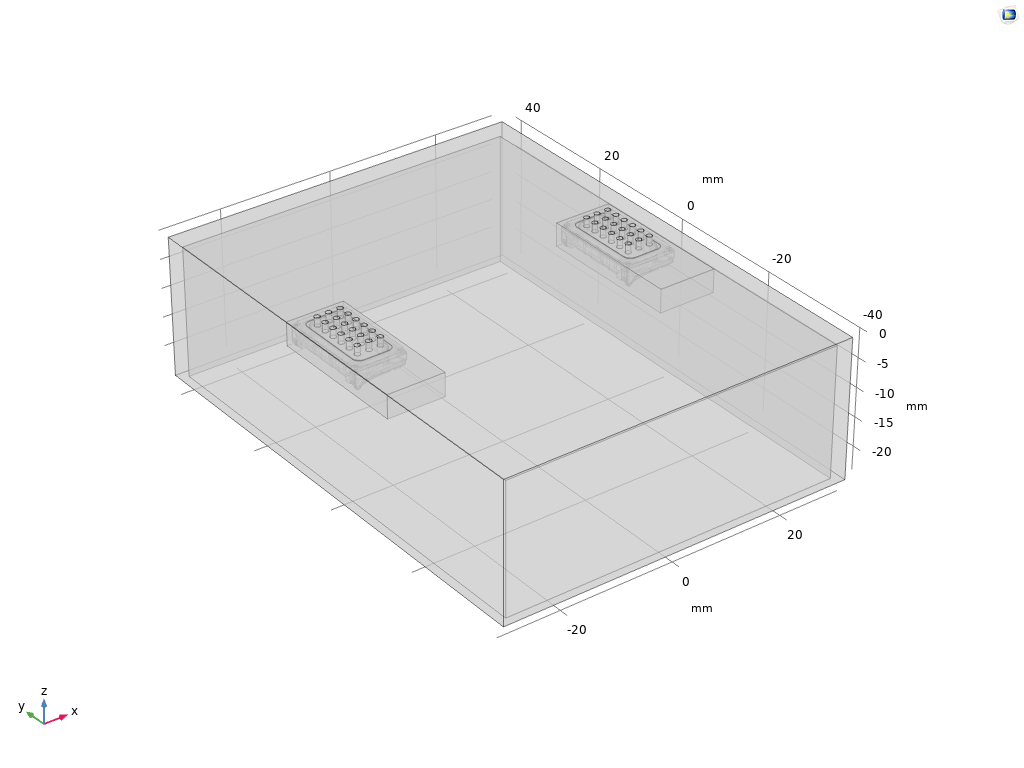
Figure 1, the positions of loudspeakers in scenario 01
The two loudspeakers inside the product are parallel, and the z-axis is expected toward the end-users. Figure 2 shows the simulation conditions and results of scenario 01.
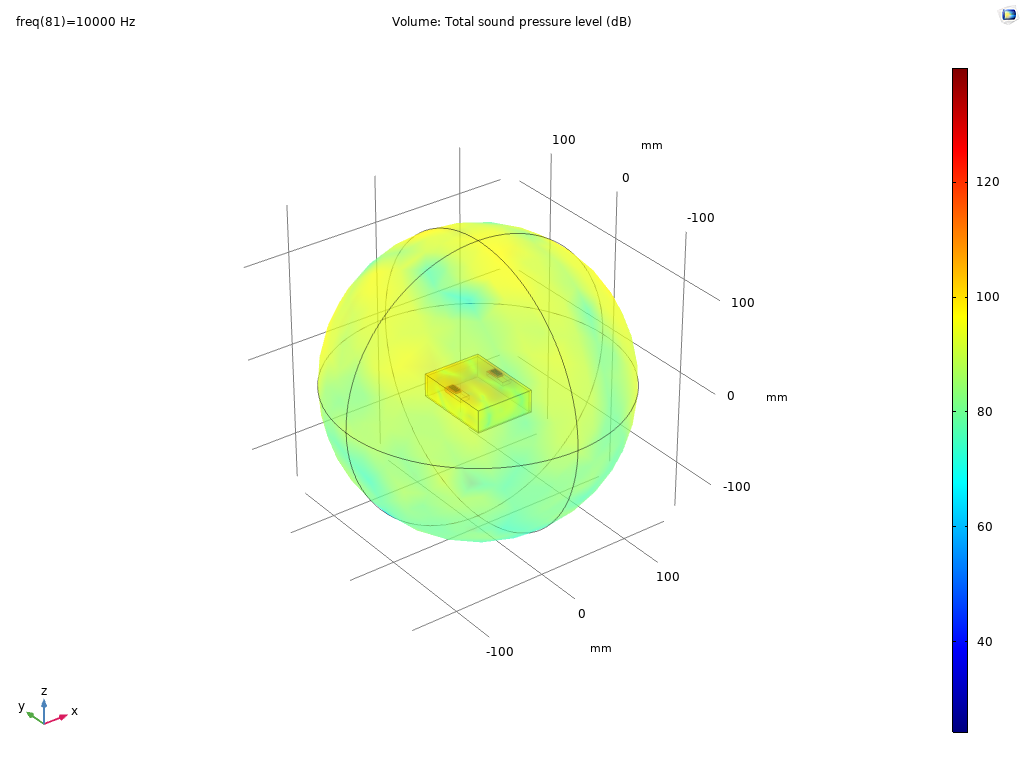
Figure 2, the simulation conditions and results of scenario 01
Figure 3 shows the simulated and predicted SPL (Sound Pressure Level) and impedance curve of scenario 01.
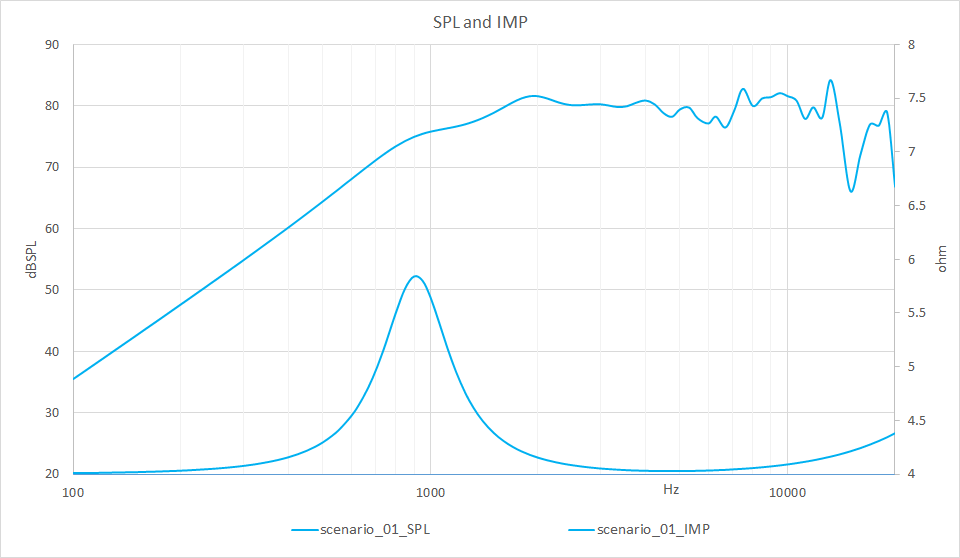
Figure 3, the simulated SPL and impedance curve of scenario 01.
Figure 4 shows the loudspeakers’ positions inside the product of scenario 02.
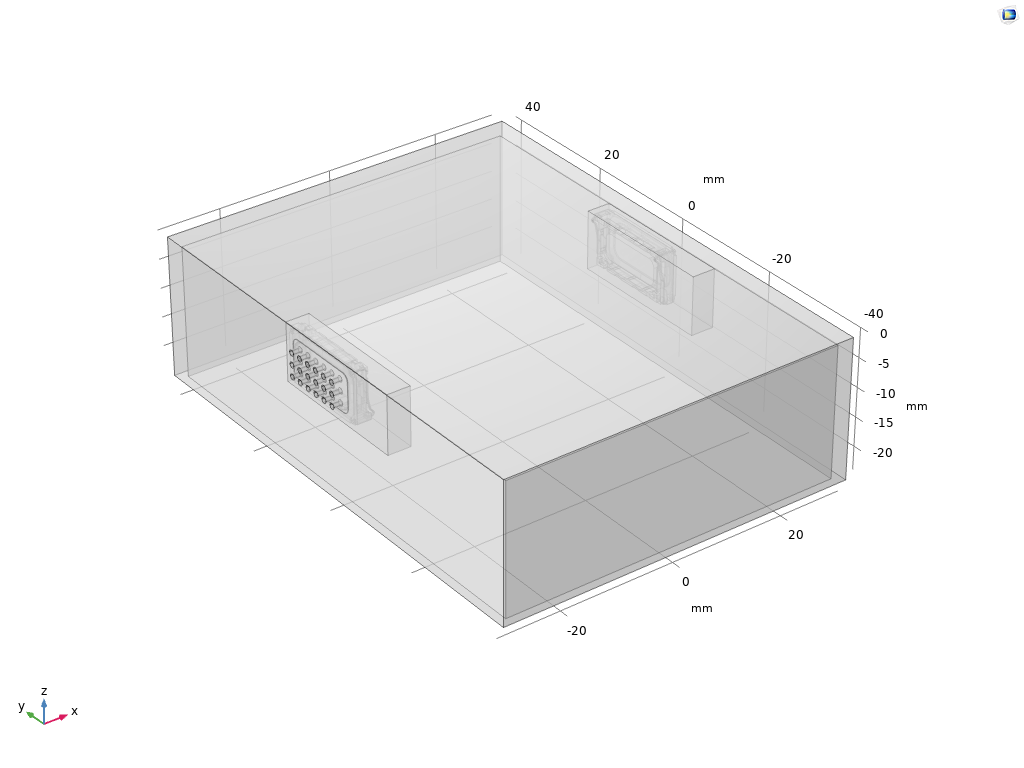
Figure 4 shows the positions of loudspeakers in scenario 02.
Figure 5 shows the simulation conditions and results of scenario 02.
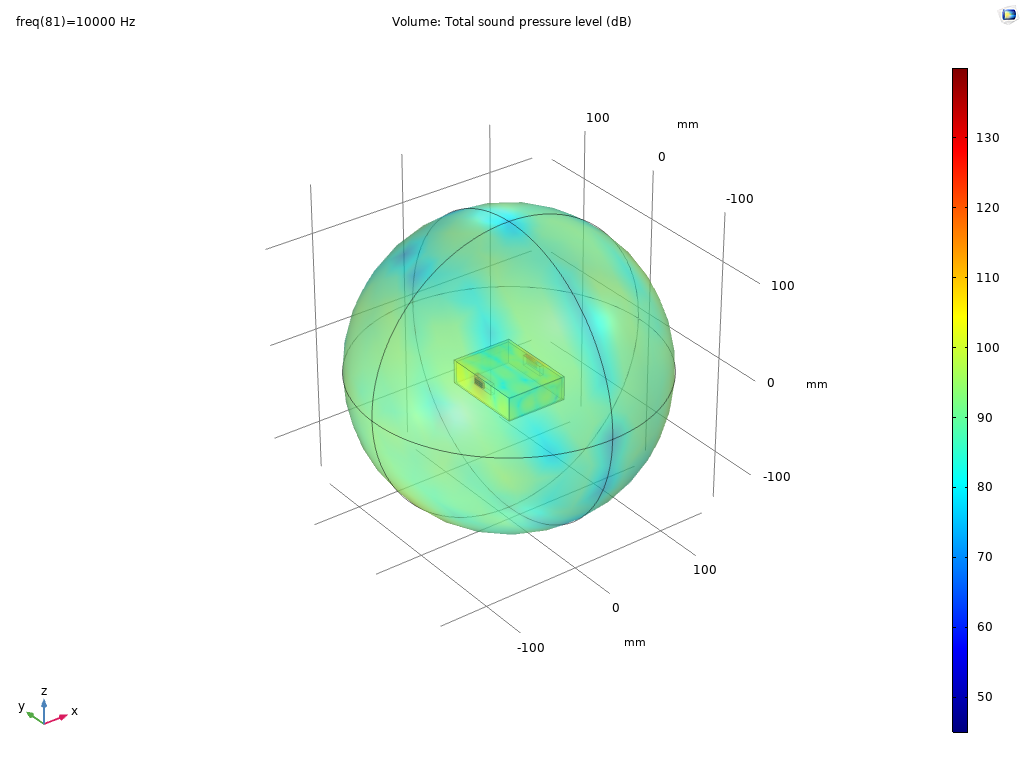
Figure 5 shows the simulation conditions and results of scenario 02.
The simulated and predicted SPL (Sound Pressure Level) and impedance curve of scenario 02 are shown in Figure 6.
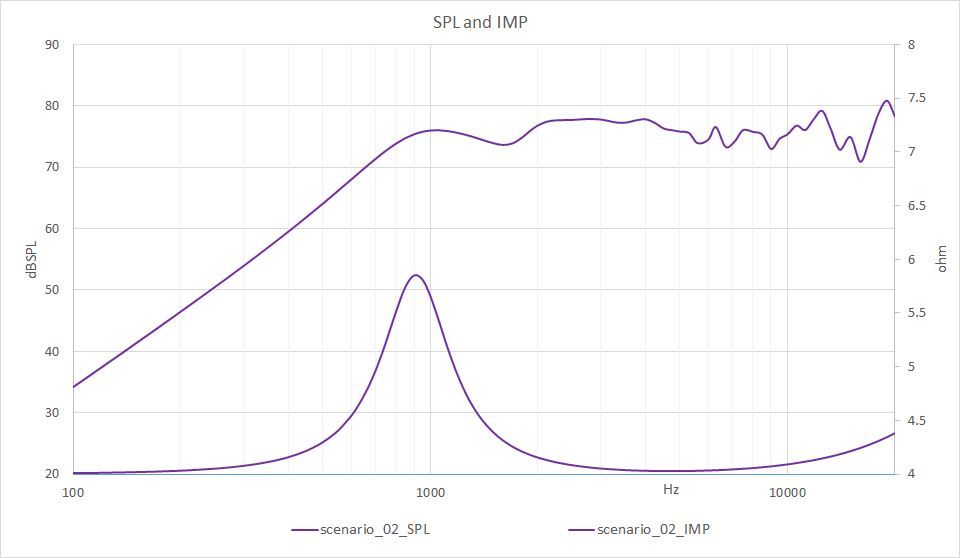
Figure 7 shows the loudspeakers’ positions inside the product of scenario 03.

Figure 7 shows the positions of loudspeakers in scenario 03.
Figure 8 shows the simulation conditions and results of scenario 03.
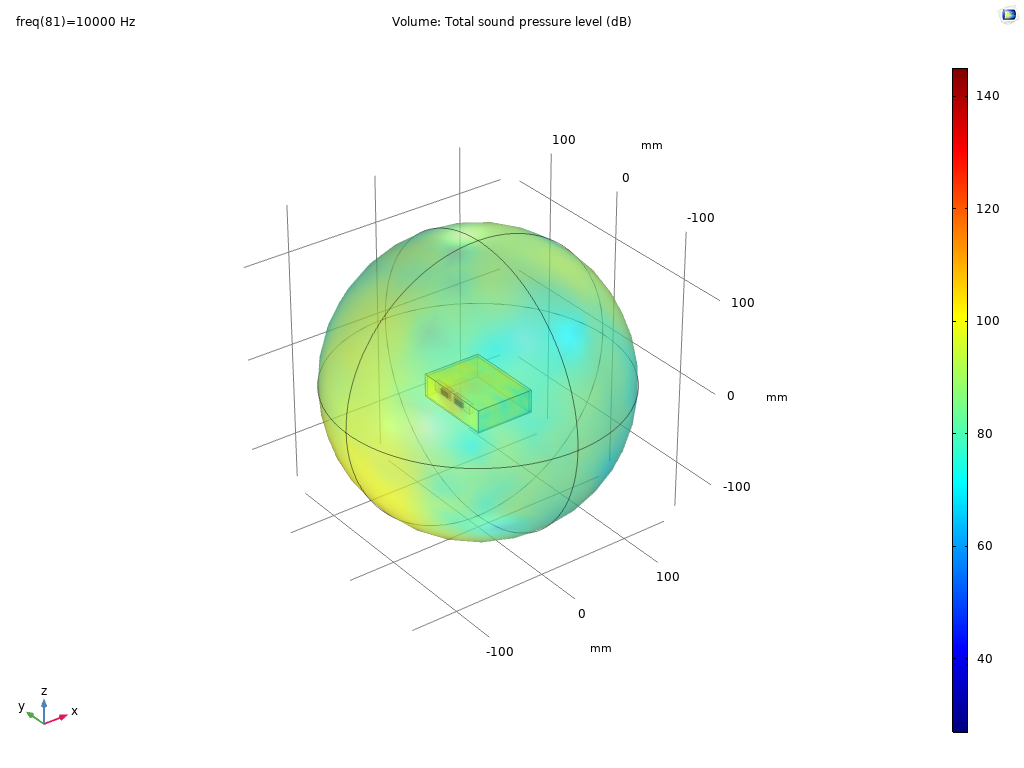
Figure 8 the simulation conditions and results of scenario 03.
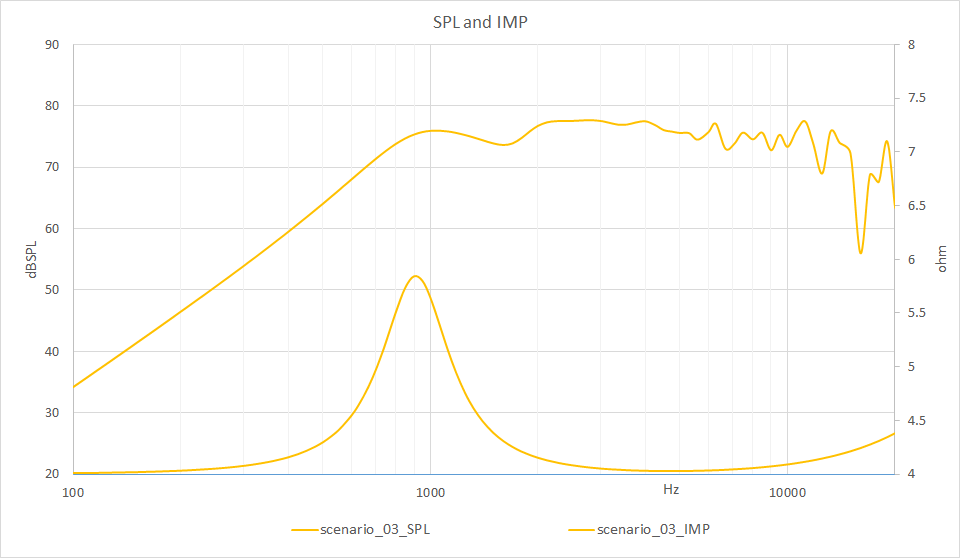
Figure 9, the simulated SPL and impedance curve of scenario 03.
Figure 10 shows the comparisons of SPLs and impedances for the three scenarios. The simulated results tell us that scenario 01 has the highest SPL.
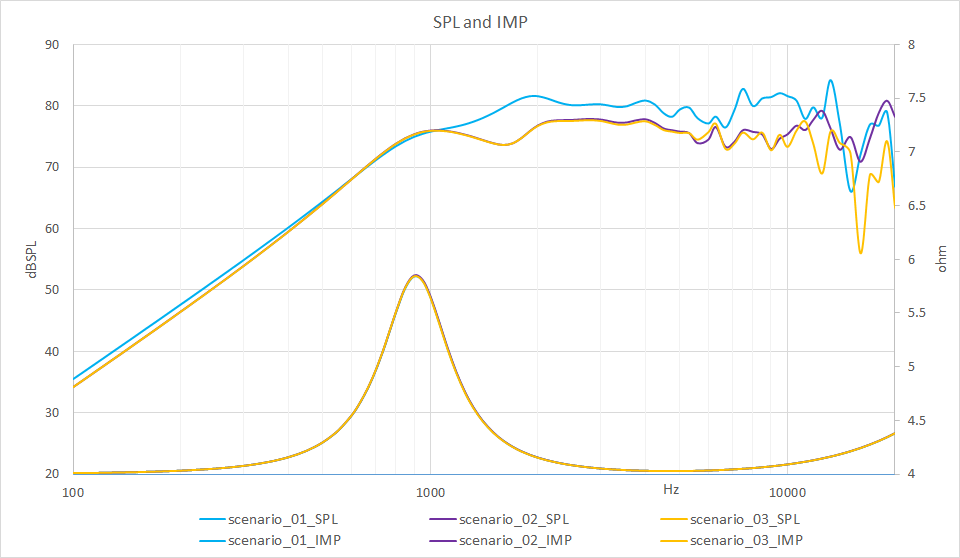
Figure 9 shows the comparison of the simulated SPL and impedance curve.
It's easy to understand that there are no impacts on the impedance curves if the loudspeakers’ positions are different. However, the SPL will be influenced by different sound fields and reflections. From analyzing the compared results, scenario 01 has the highest SPL from around 1.2 KHz to 10 KHz. This means that it’s the optimized position for the product if loudness is an important requirement for design purposes. Scenarios 02 and 03 have almost the same performance if the product’s applications don’t need to extend the high frequencies over 10KHz. Or the cancellations of sound fields at high frequencies are more serious in scenario 03.