 RFQ
RFQ技術記事
-
スピーカー設置位置が音響性能に与える影響:シミュレーション解析による製品音質設計の最適化
音響装置を備えた民生用電子製品市場では、音質性能を重視する製品もあれば、外観と価格を重視する製品もある。ユニークな外観デザインは、時に製品内でのスピーカー配置を制限する。外観と優れた音質の両立をどう実現するか?これは設計者が常に真剣に考えるべき課題である。外観が概ね確定した後、有限要素解析ツールを用いて異なるスピーカー配置が製品音質に与える影響を予測・分析することで、最適なスピーカー位置を事前に選択できます。
ここでは同一製品内に配置した3種類の異なる位置シナリオのシミュレーション解析結果を示す。
図1はシナリオ1のスピーカー配置位置を示しています。
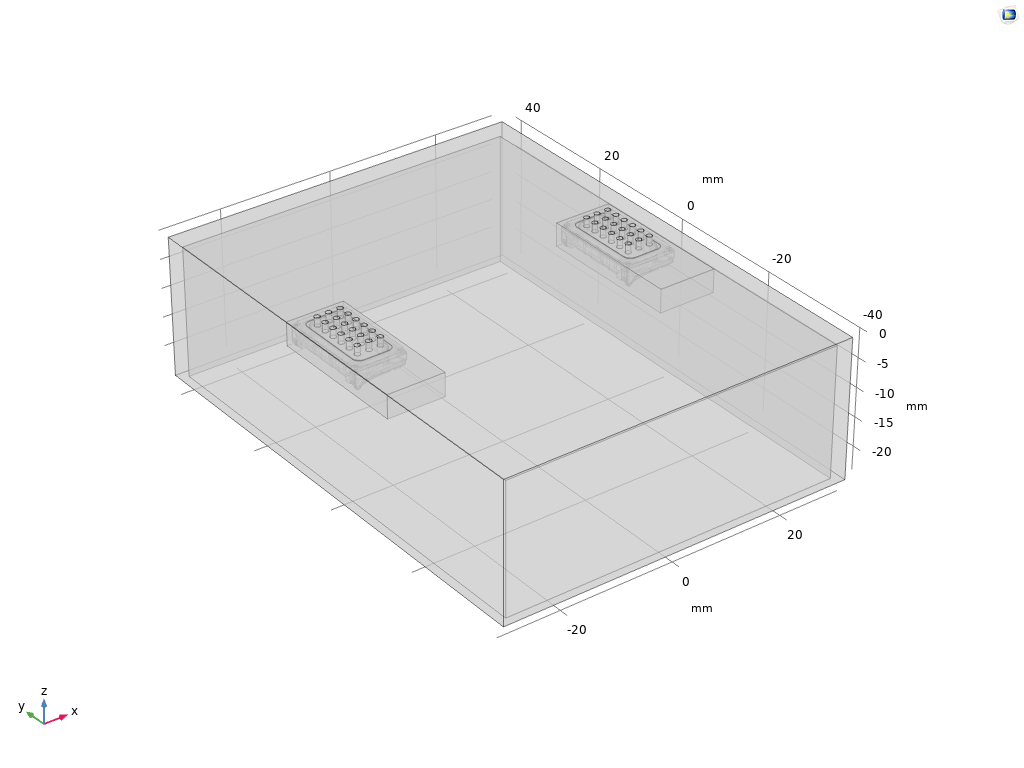
図1:シナリオ1のスピーカー配置
2つのスピーカーは並列接続されており、Z軸はユーザーのリスニング位置を示す。
図2はシナリオ1のシミュレーション条件設定と結果を示しています。
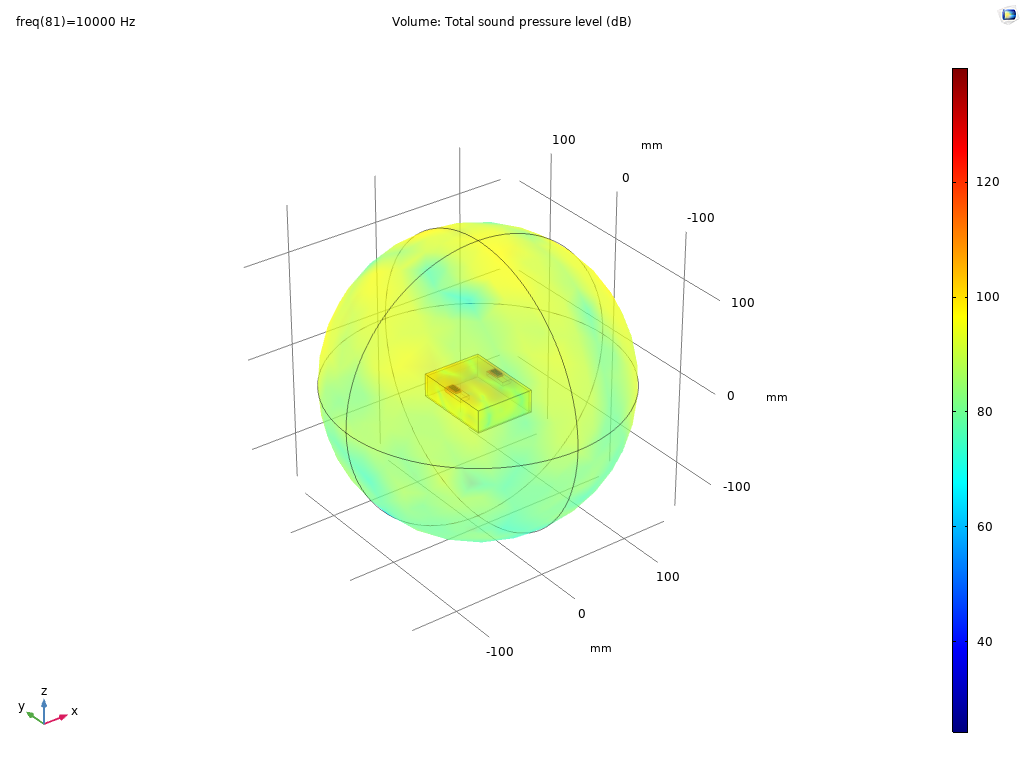
図2、シナリオ1のシミュレーション条件設定と結果
図3はシナリオ1のシミュレーション及び予測による音圧とインピーダンス曲線である。
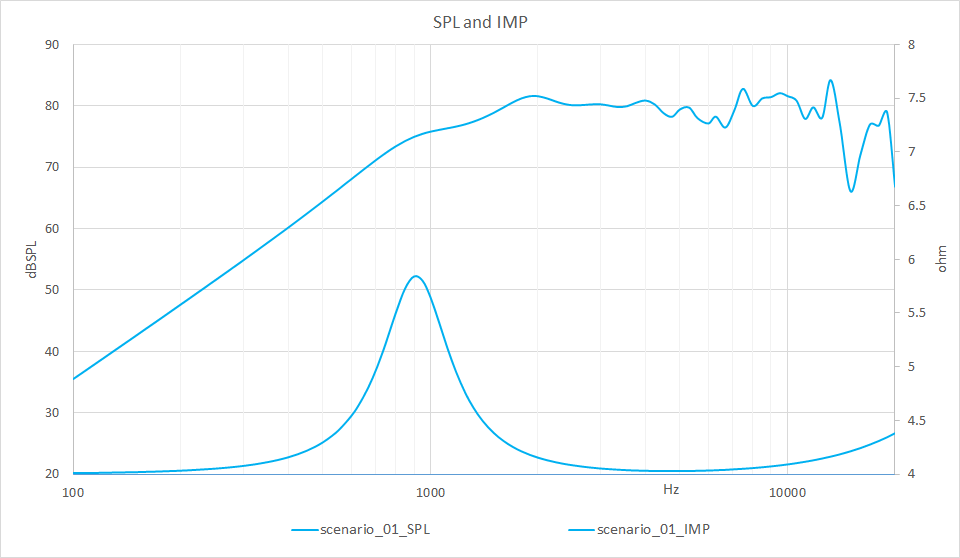
図3、シナリオ1の音圧とインピーダンスのシミュレーション曲線
図4はシナリオ2のスピーカー配置位置を示す。
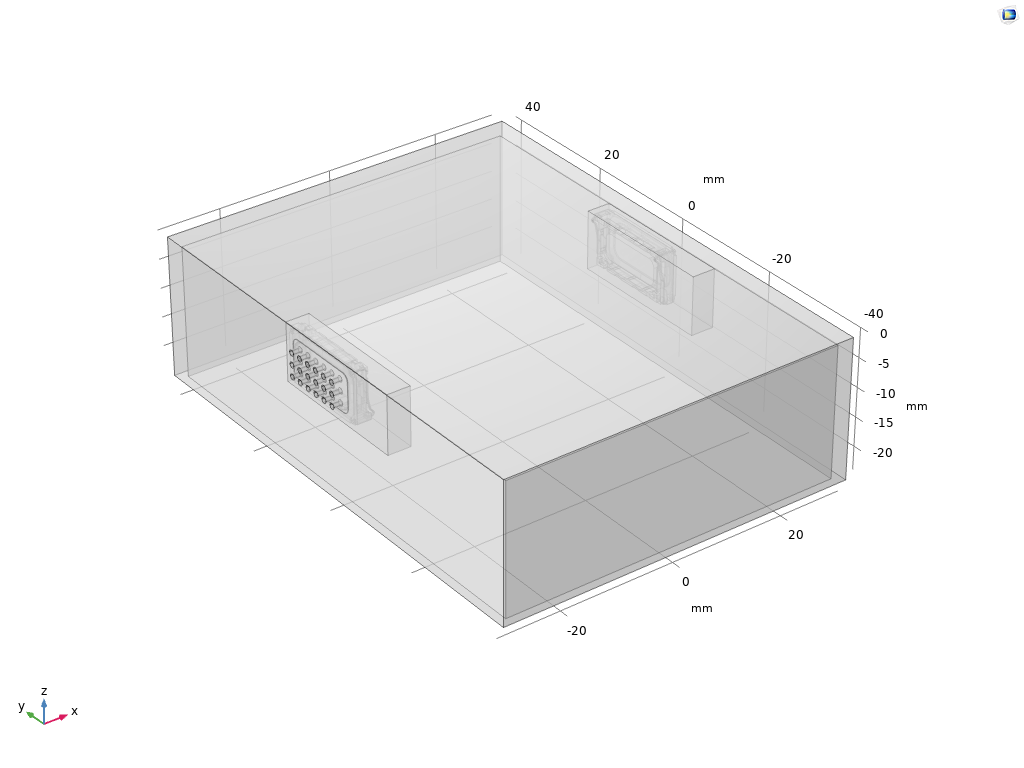
図4、シナリオ2のスピーカー位置
図5はシナリオ2のシミュレーション条件設定と結果を示す。
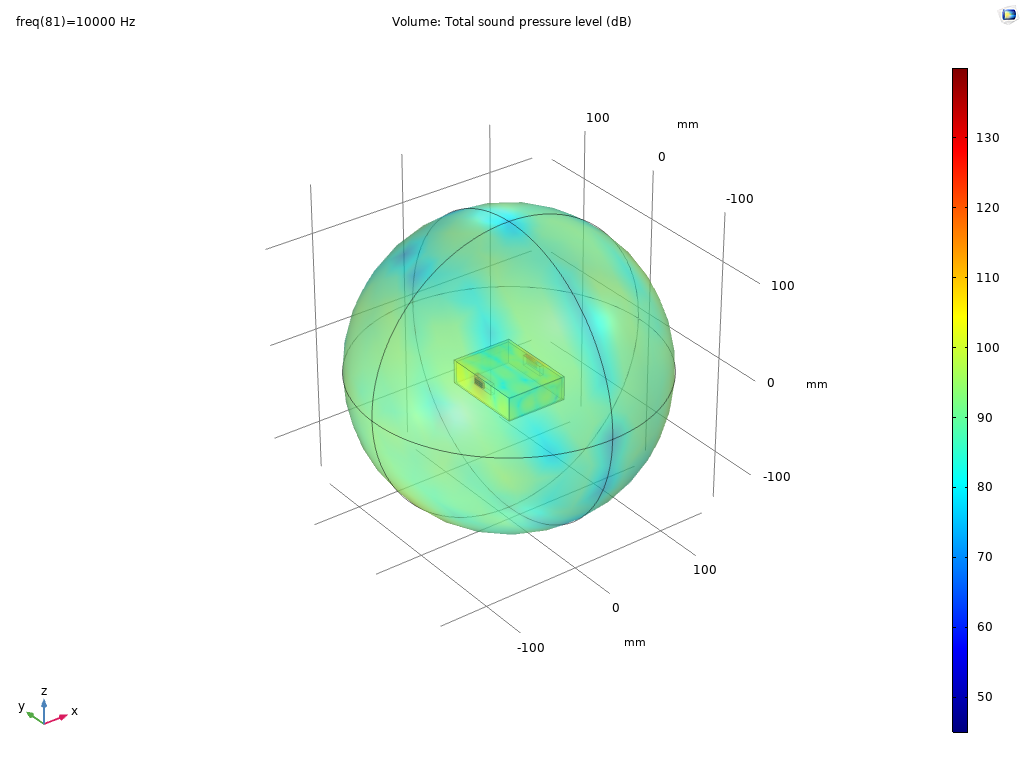
図5、シナリオ2のシミュレーション条件設定と結果
図6はシナリオ2のシミュレーションおよび予測による音圧とインピーダンス曲線である。
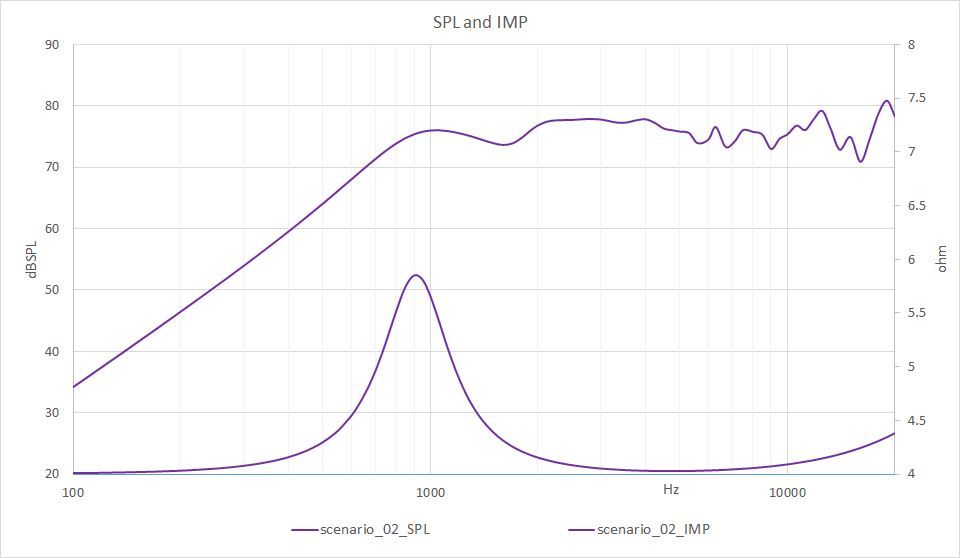
図6、シナリオ2の音圧とインピーダンスのシミュレーション曲線
図7はシナリオ3のスピーカー配置位置を示す。

図7、シナリオ3のスピーカー配置位置を示す。
図8はシナリオ3のシミュレーション条件設定と結果を示す。
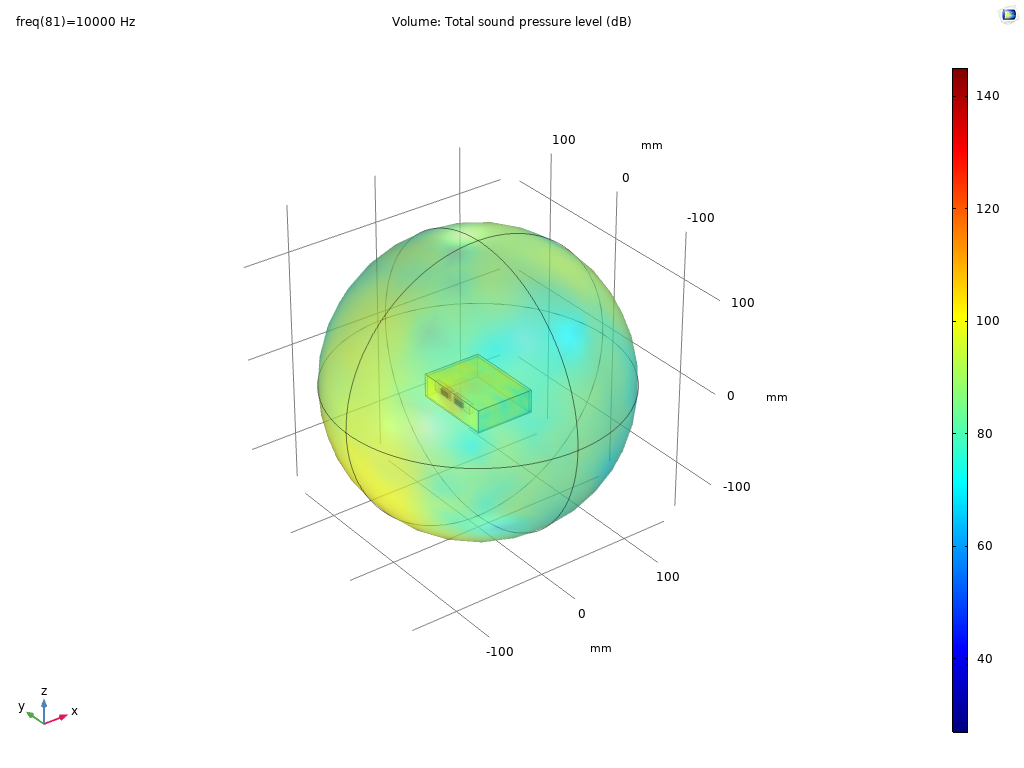
図8、シナリオ3のシミュレーション条件設定と結果
図9はシナリオ3のシミュレーションおよび予測による音圧とインピーダンス曲線である。
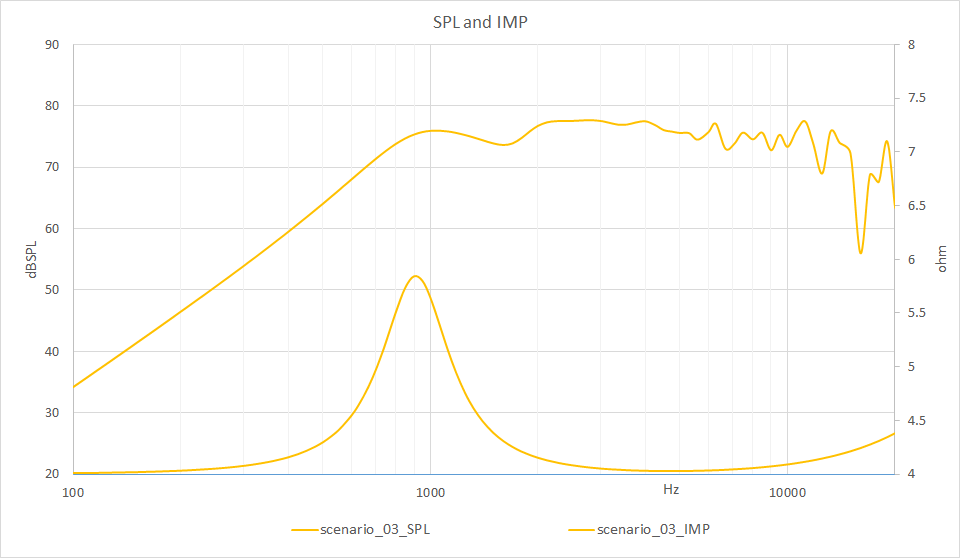
図9、シナリオ3の音圧とインピーダンスのシミュレーション曲線
図10は3つの異なるシナリオの比較曲線であり、音圧が最も高いのはシナリオ1の配置方式である。
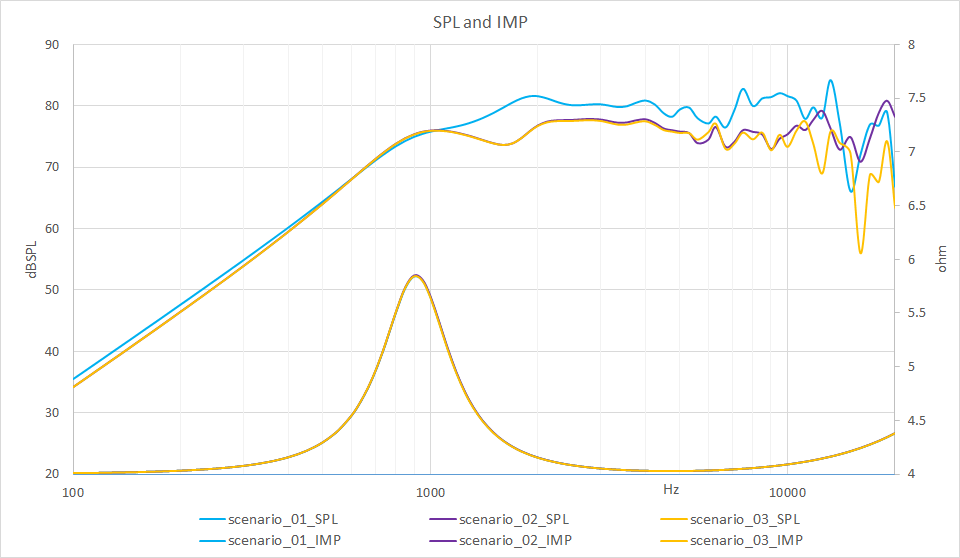
図10、シミュレーション曲線の比較
容易に理解できるように、スピーカーの設置位置の違いはインピーダンス曲線に影響を与えないが、音圧は音場の差異と反射の影響を受ける。比較結果から分析すると、シナリオ1は約1.2kHzから10kHzで音圧が最も高く、これは高音圧が製品設計の重点である場合、シナリオ1が最適な設置位置であることを示している。製品用途で10kHzを超える高域拡張が不要な場合、シナリオ2と3はほぼ同等の音圧特性を示す。ただし、10kHz以上の高域ではシナリオ3で音場干渉による深刻な問題が発生する。
当サイトの一部の文章は、AI翻訳により訳されたものです。内容の正確性については、原文の中国語版をご参照いただくか、弊社までお問い合わせください。ご理解のほど、よろしくお願いいたします。